Remote-sensing research
Sentinel-1 satellite avalanche detection.
We use radar observations from the Copernicus Sentinel-1 satellite mission to find surface changes that may warrant further investigation. A detection starts a filtering process; it is not an automatic claim that an avalanche occurred.
- Satellite mission
- Copernicus Sentinel-1 satellite
- Sensor
- Synthetic aperture radar
- Screening
- 20 m, then 10 m
- Status
- Research workflow
Screening
Separating change from evidence.
The Copernicus Sentinel-1 satellite mission uses synthetic aperture radar, often shortened to SAR, to observe the ground through cloud and darkness. Comparing satellite radar images from before and after a snowy period can reveal changes in radar response, but vegetation, moisture, imaging geometry and other surface processes can produce similar signals.
The workflow therefore uses several automated stages:
- Screen each radar pair at 20 m resolution for surface changes.
- Look for the same location from another viewing direction.
- Rerun surviving locations at 10 m resolution.
- Compare terrain, snow conditions and later same-track images.
- Retain a survivor as an unverified satellite detection until exact-site external evidence is available.
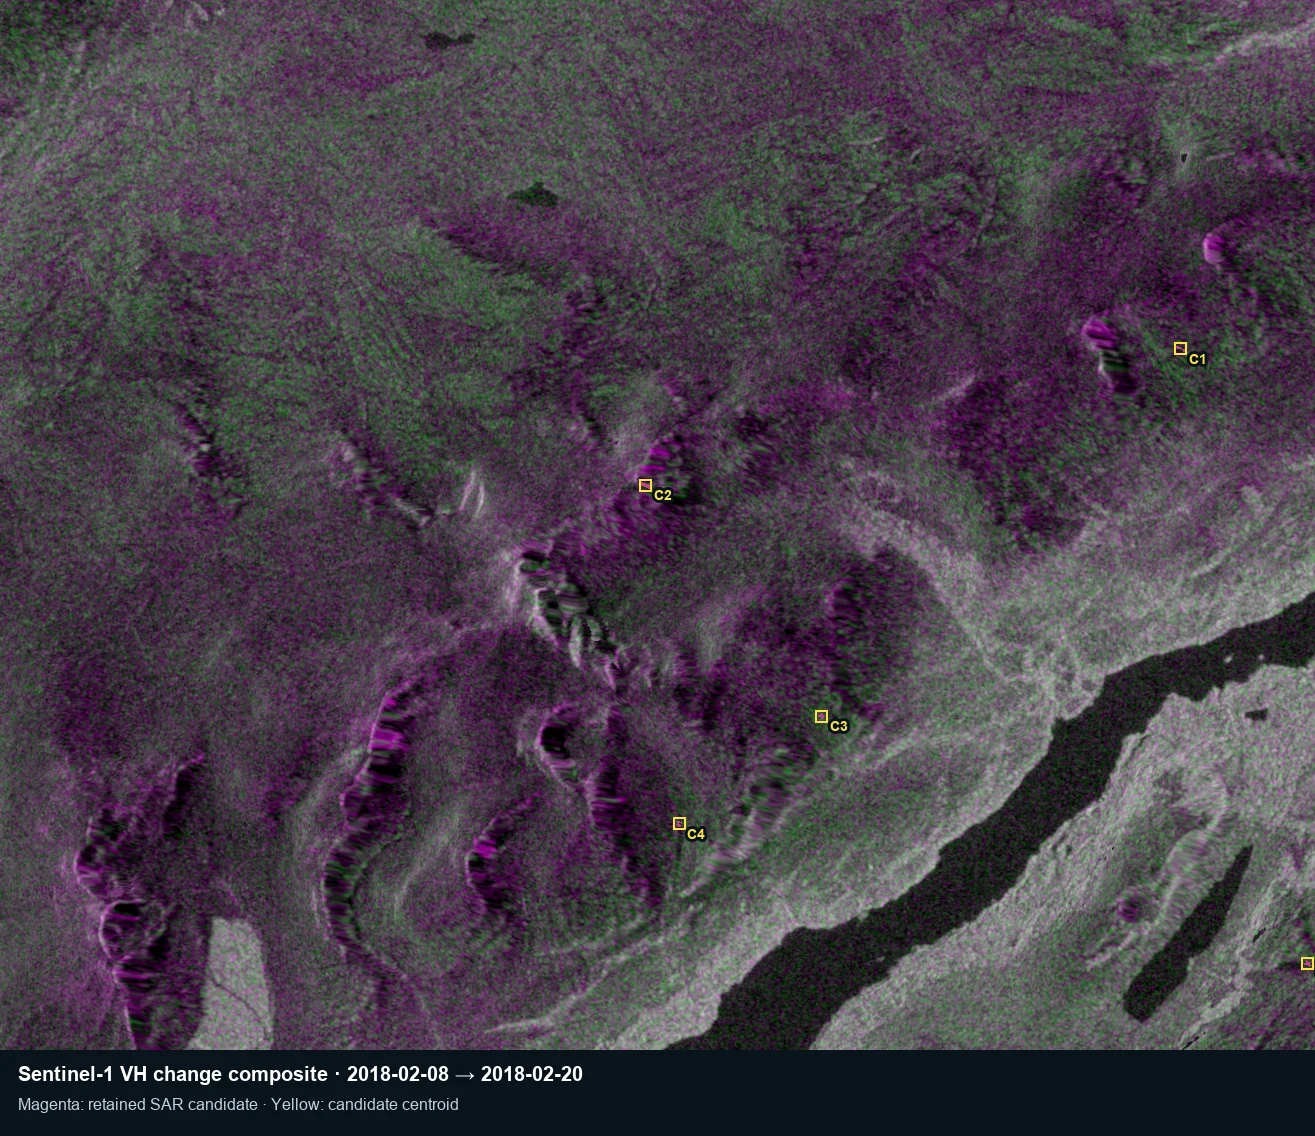
The yellow boxes in the example mark the centres of first-pass radar changes, not mapped avalanches.
Processing
From radar acquisitions to a candidate.
The pipeline uses Sentinel-1 radiometrically terrain-corrected (RTC) imagery from Microsoft Planetary Computer, with GDAL aligning subsets to a common grid. Normally, before-and-after comparisons use the same orbit and polarisation. Terrain correction is supplied by the RTC product, not an in-house ESA SNAP processing chain.
Thresholds and radar blind spots
Backscatter change is 10 log₁₀(after / before) for linear input values, expressed in decibels. The detector defaults to a minimum increase of 3 dB, combined with colour-composite, connected-area and terrain filters. Research runs can use other settings; 3 dB is not a universal avalanche signature.
The detector accepts an extra quality mask, but a complete local-incidence-angle, radar-shadow and layover mask has not been established for every published comparison. Wet snow and changes in surface roughness can also alter backscatter. Repeat geometries, snow context and later control images help investigate those alternatives, not eliminate them.
Screening example
Most candidates are rejected.
In the England and Wales example presented in our August 2026 film, 787 first-pass changes were reduced to 10 after the cross-geometry screen. That is about 1.3% of that candidate set, not an avalanche confirmation rate or an accuracy score. The retained results still require exact-site external evidence before they can be described as confirmed avalanches.
The low survival rate is expected. The process is designed to begin broadly and then remove changes that are inconsistent across resolution, viewing geometry, terrain and time.
- 787
- First-pass radar changes
- 10
- Survived cross-geometry screening
- 1.3%
- Retained for further analysis
Application
Additional evidence for data-sparse regions.
The work is intended to increase the evidence available for avalanche research where systematic event records are limited. It may support retrospective event discovery, comparison with weather and snowpack histories, and collaboration with forecasting or research organisations.
Interpretation limit. Radar screening cannot by itself confirm an avalanche. Results must retain their processing history, uncertainty and validation status.
Discuss satellite detection research